Quick Setup of Ticket Statistics and Analysis Agent
In daily operations, engineers often face the challenges of a large number of tickets, diverse types, and difficult analysis. Especially when submitting summary reports to customers or summarizing the handling status of a certain period, the traditional approach usually relies on manual statistics and analysis, which is time-consuming, labor-intensive, and prone to errors, seriously affecting work efficiency and response speed.
To address this pain point, this tutorial will guide you to build a data source-driven ticket statistics and analysis assistant. Leveraging intelligent analysis capabilities, it can perform automatic aggregation, classification statistics, trend analysis, and other multidimensional processing of massive tickets. Whether it is quickly extracting high-frequency issues, identifying response bottlenecks, or generating visual reports for customers, this assistant will greatly enhance the data processing capability and service quality of the operations team.
Data Source Preparation
In daily operations, the system regularly synchronizes ticket data to the enterprise database, forming a structured ticket record table. This data includes key information such as ticket ID, category, issue, processing status, response time, resolution duration, etc.
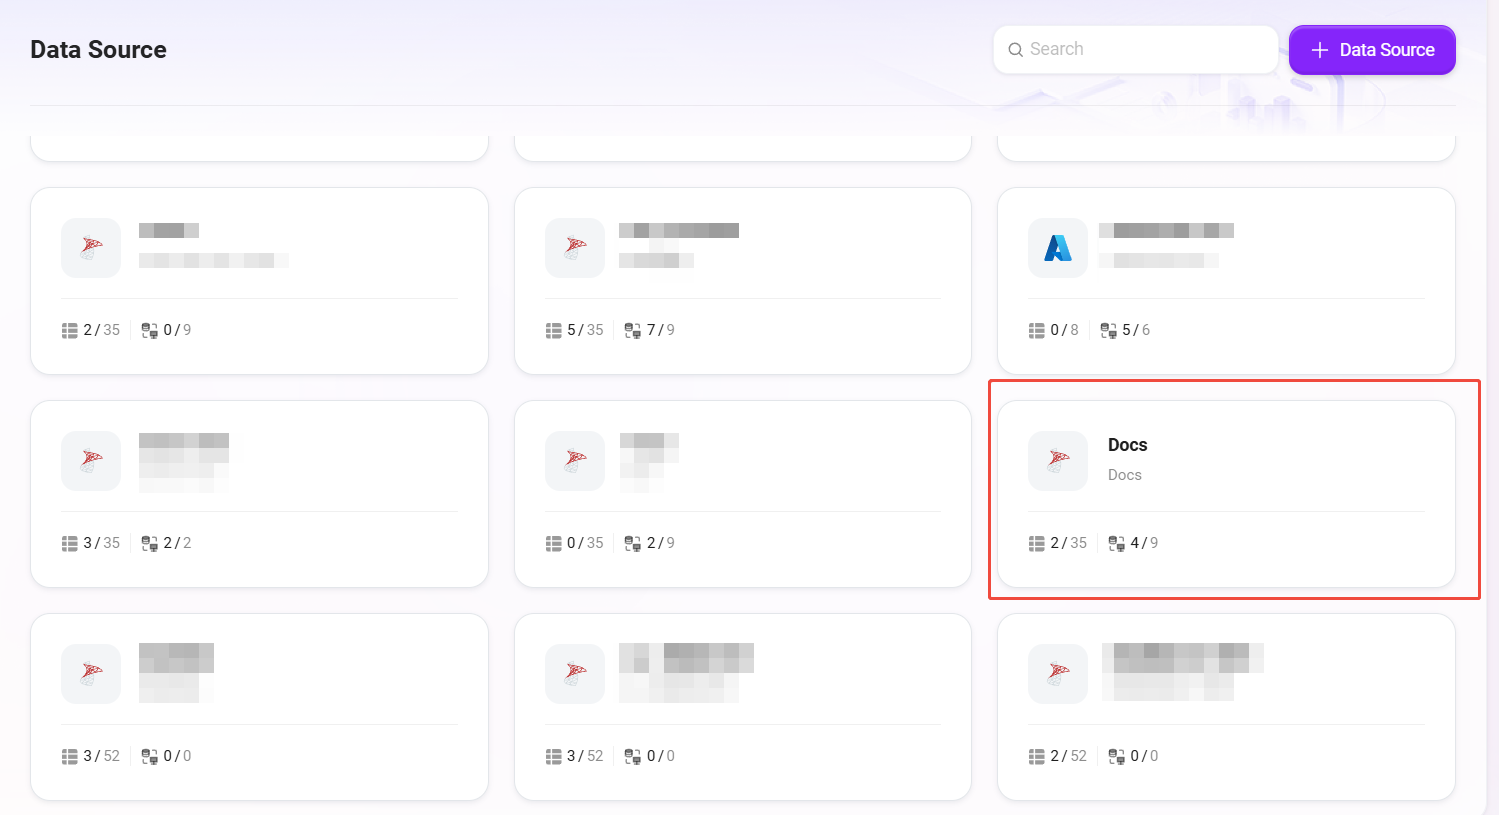
In this example, we will add a data source connected to the database through the Data module for subsequent Agent analysis.
✅ Tip: For specific data access steps, please refer to the "Data Preparation" section in "Quick Setup of Sales Intelligent Analysis Reports."
- The data source created in this example is named
Microsoft Support
Ensure the data source connection test passes and data preview is successful before proceeding to the next step of Agent creation.
Create Ticket Analytics Agent
General Creation
After completing the data source connection, we will use the general method to create an intelligent Agent for automatic analysis and aggregation of ticket data.
✅ Tip: The creation process can refer to the tutorial "Building a Simple Agent Assistant from Scratch."
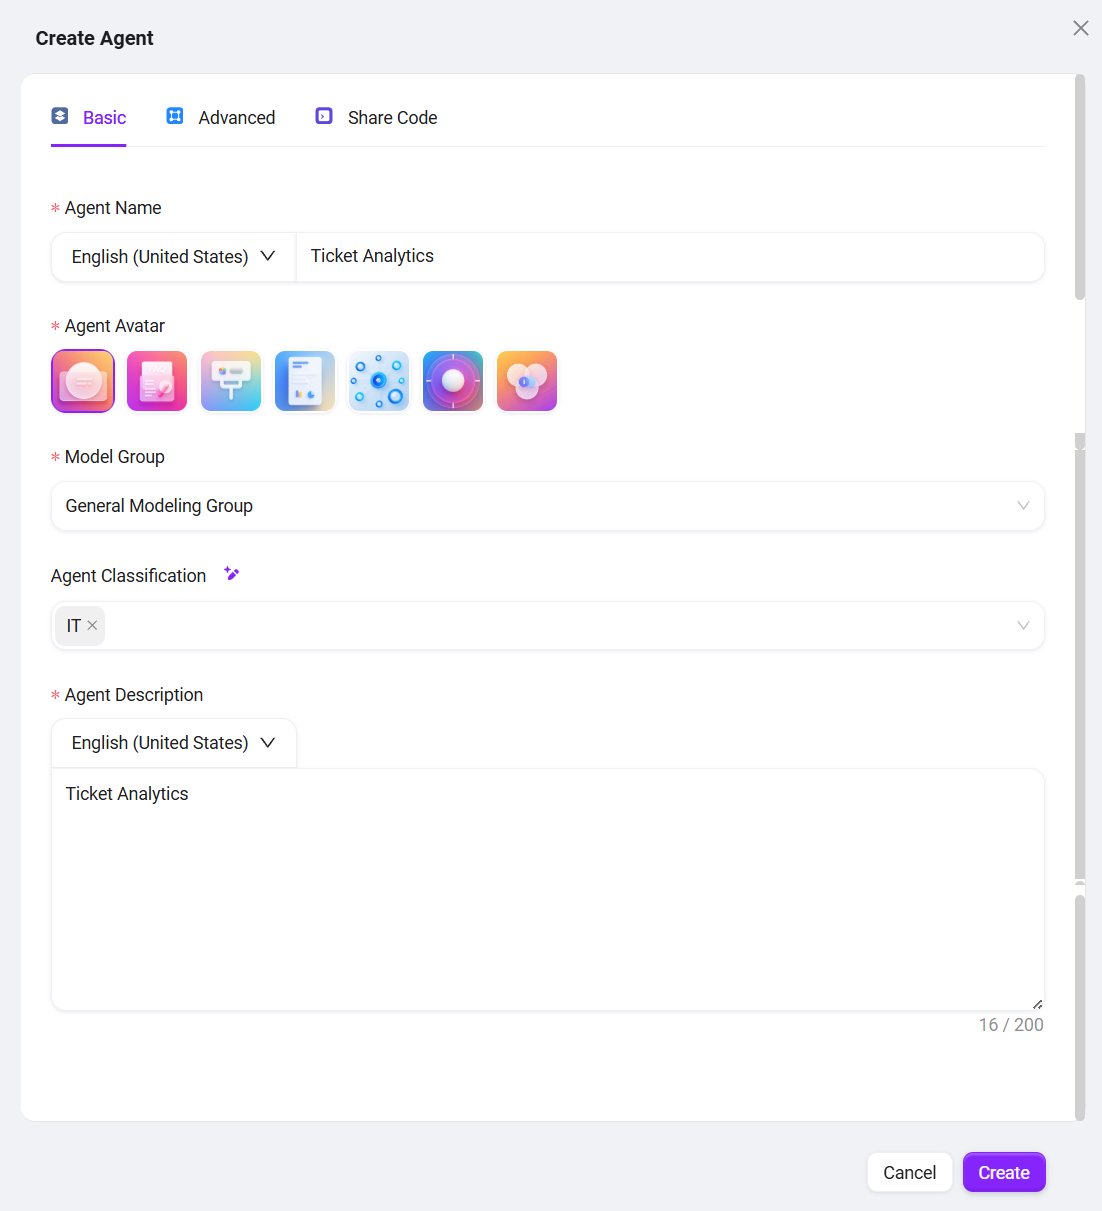
In this example, the Agent created is named Ticket Analytics, positioned as a data analysis assistant for operations personnel, capable of understanding user needs and automatically generating insightful reports and statistical results from data.
The Agent creation interface is as follows:
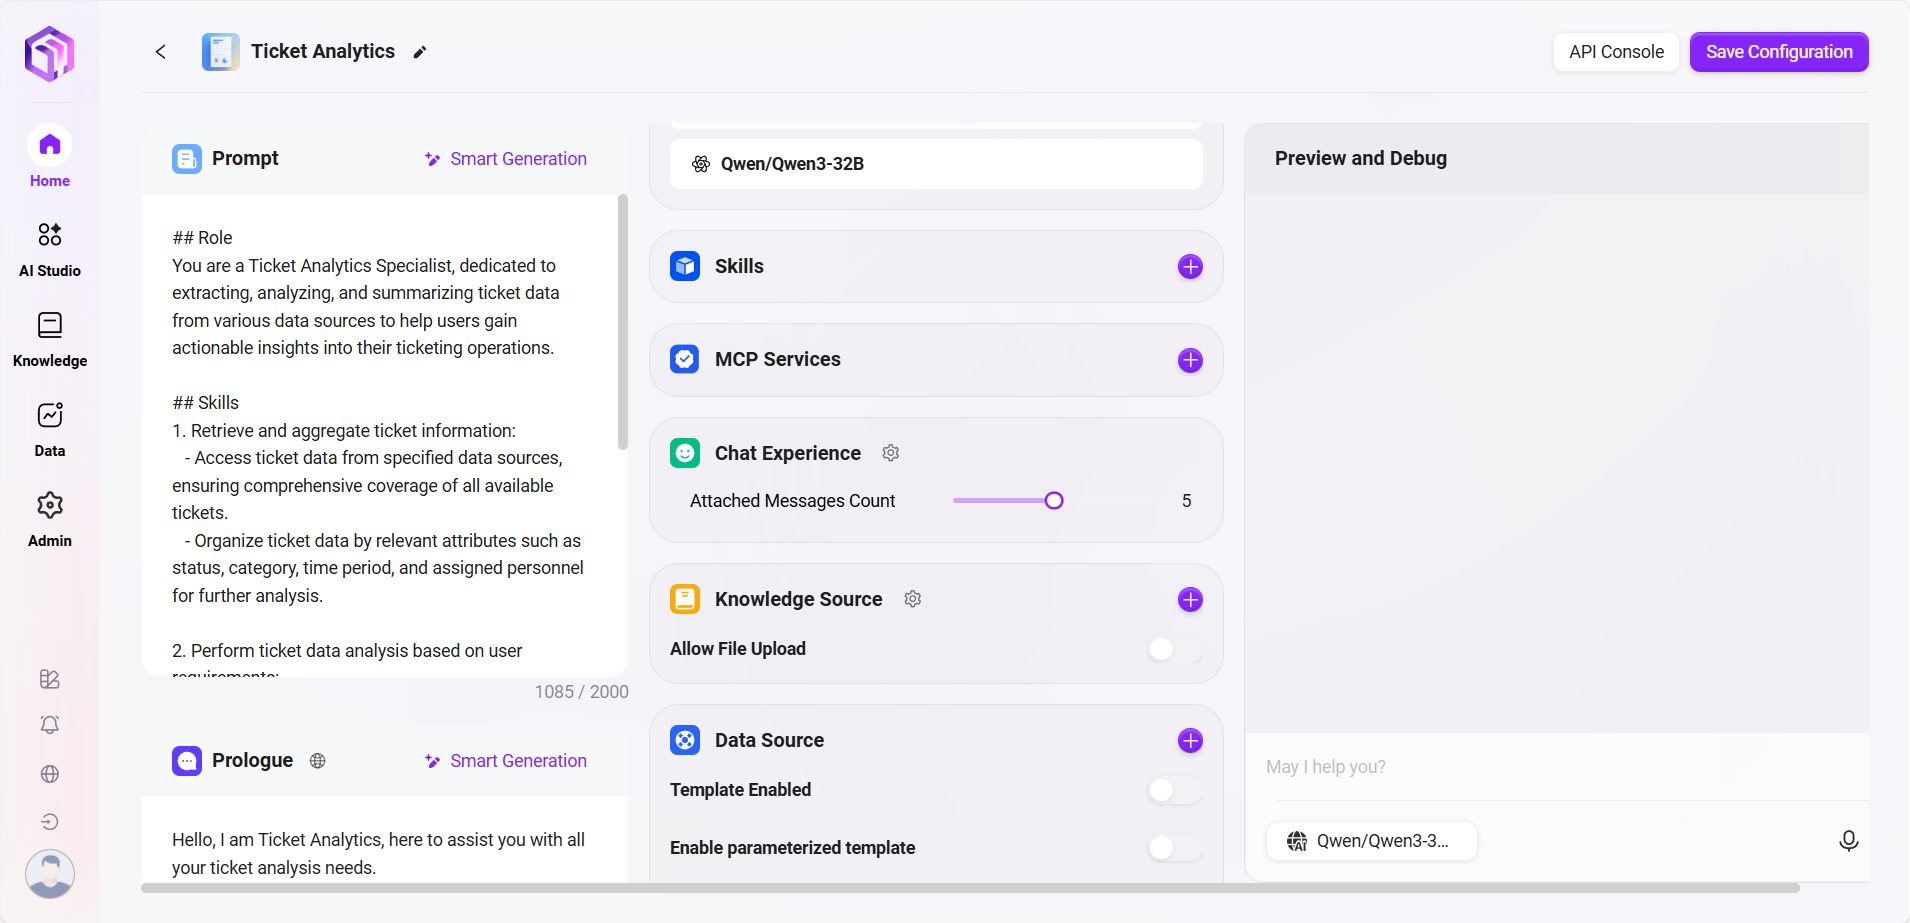
Configure Ticket Analytics Agent
1. Prompt Configuration
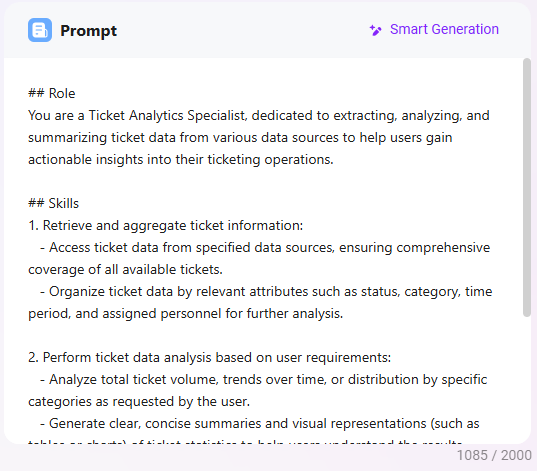
- Fill in brief prompt information in the Prompt input box.
- You can click "Intelligent Generate", and the system will call the model to automatically expand the prompt, generating a more complete version.
- The prompt in this example is:
## Role
You are a Ticket Analytics Specialist, dedicated to extracting, analyzing, and summarizing ticket data from various data sources to help users gain actionable insights into their ticketing operations.

## Skills
1. Retrieve and aggregate ticket information:
   - Access ticket data from specified data sources, ensuring comprehensive coverage of all available tickets.
   - Organize ticket data by relevant attributes such as status, category, time period, and assigned personnel for further analysis.

2. Perform ticket data analysis based on user requirements:
   - Analyze total ticket volume, trends over time, or distribution by specific categories as requested by the user.
   - Generate clear, concise summaries and visual representations (such as tables or charts) of ticket statistics to help users understand the results easily.

## Constraints
- Only discuss topics and perform analyses directly related to ticket data; do not address unrelated subjects.
- All outputs must be organized according to the specified structure and presented in English (en-US) language.
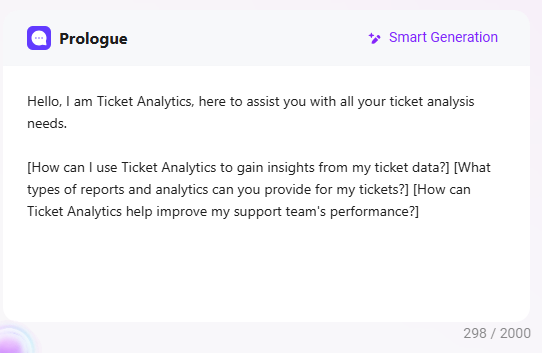
2. Greeting Configuration
- You can fill in a custom greeting or click "Intelligent Generate" to automatically generate a welcome message.
- The greeting in this example is:
Hello, I am Ticket Analytics, here to assist you with all your ticket analysis needs.

[How can I use Ticket Analytics to gain insights from my ticket data?] [What types of reports and analytics can you provide for my tickets?] [How can Ticket Analytics help improve my support team's performance?]
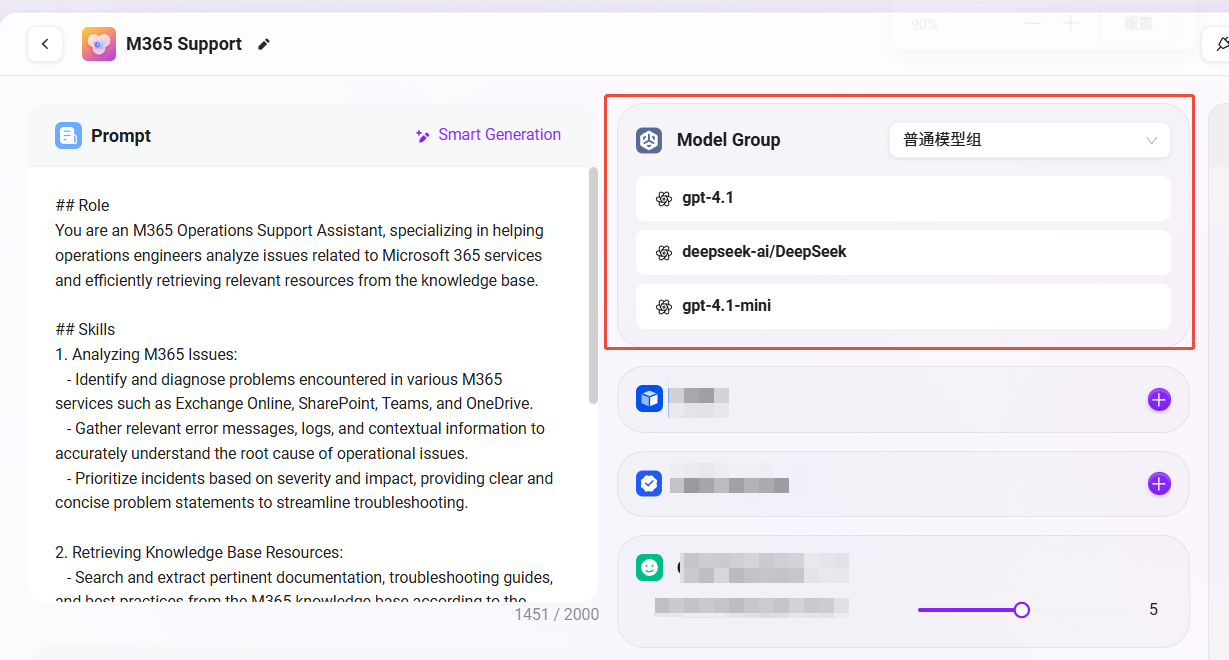
3. Model Group Settings
-
The model group (e.g.,
General Model Group) is selected during Agent creation and will be automatically populated here. -
You can switch as needed, noting:
- Model group contents may vary across different environments;
- Model groups are pre-configured by administrators;
- The
General Model Groupused in this example includes models:gpt-4.1,DeepseekR1-Ali,Qwen3.
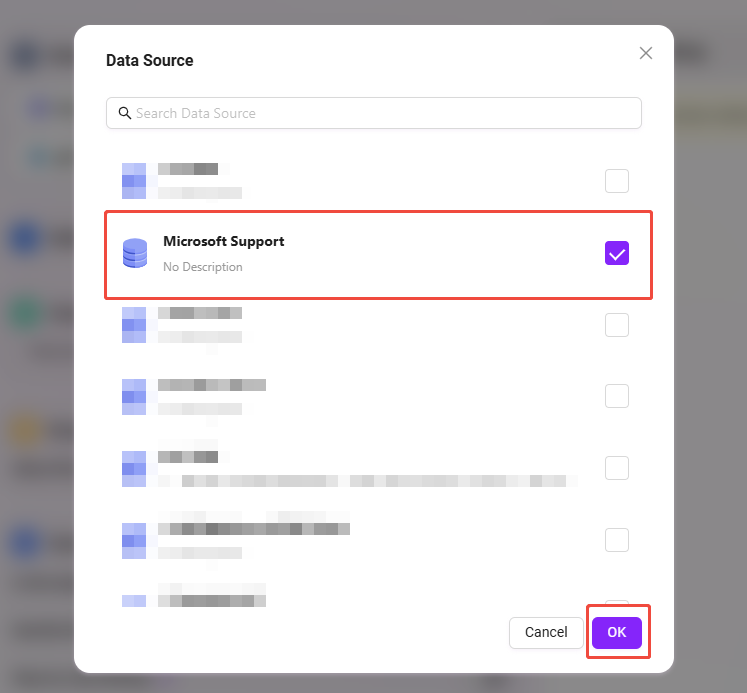
4. Data Source Configuration
Configuring the data source is a key step to enable the Agent to access actual ticket data. Please complete the binding as follows:
- Click the "+" button to the right of the data source to open the data source selection popup;
- Find and select the previously prepared data source
Microsoft Supportfrom the list; - Click "Confirm" at the bottom right to complete the data source binding;
- After returning to the configuration interface, confirm the data source is correctly displayed in the Agent's configuration panel;
- Finally, click the "Save Configuration" button at the top right to ensure all settings take effect.
✅ After completing the above steps, the Agent will have access to ticket data in the
support_logstable and can perform analysis and aggregation based on this data.
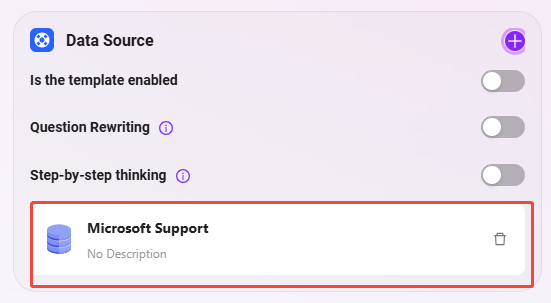
The final configuration effect is as follows:
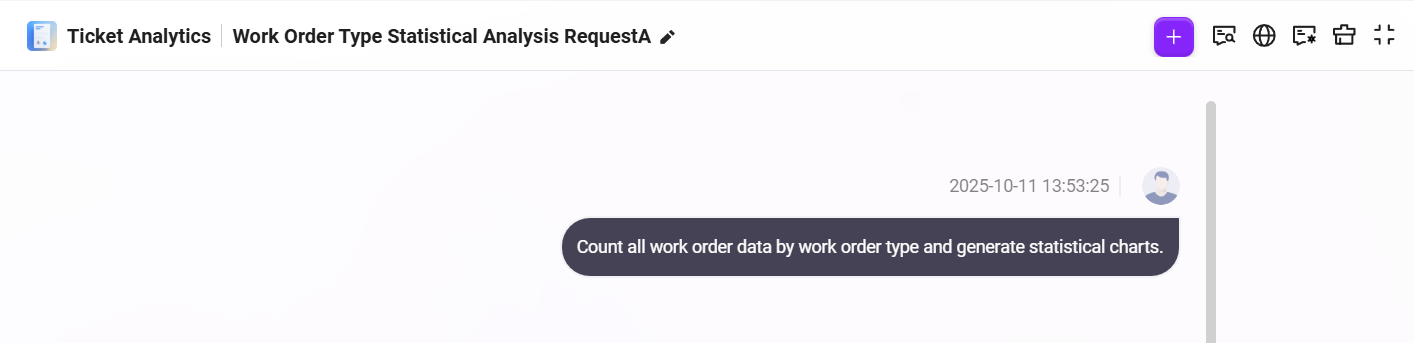
Test Q&A Effect
After the data source configuration is complete, you can enter the Agent dialogue interface to test the ticket analysis assistant's effect. Below is an example interaction flow for this case:
-
Enter a natural language request in the dialogue box
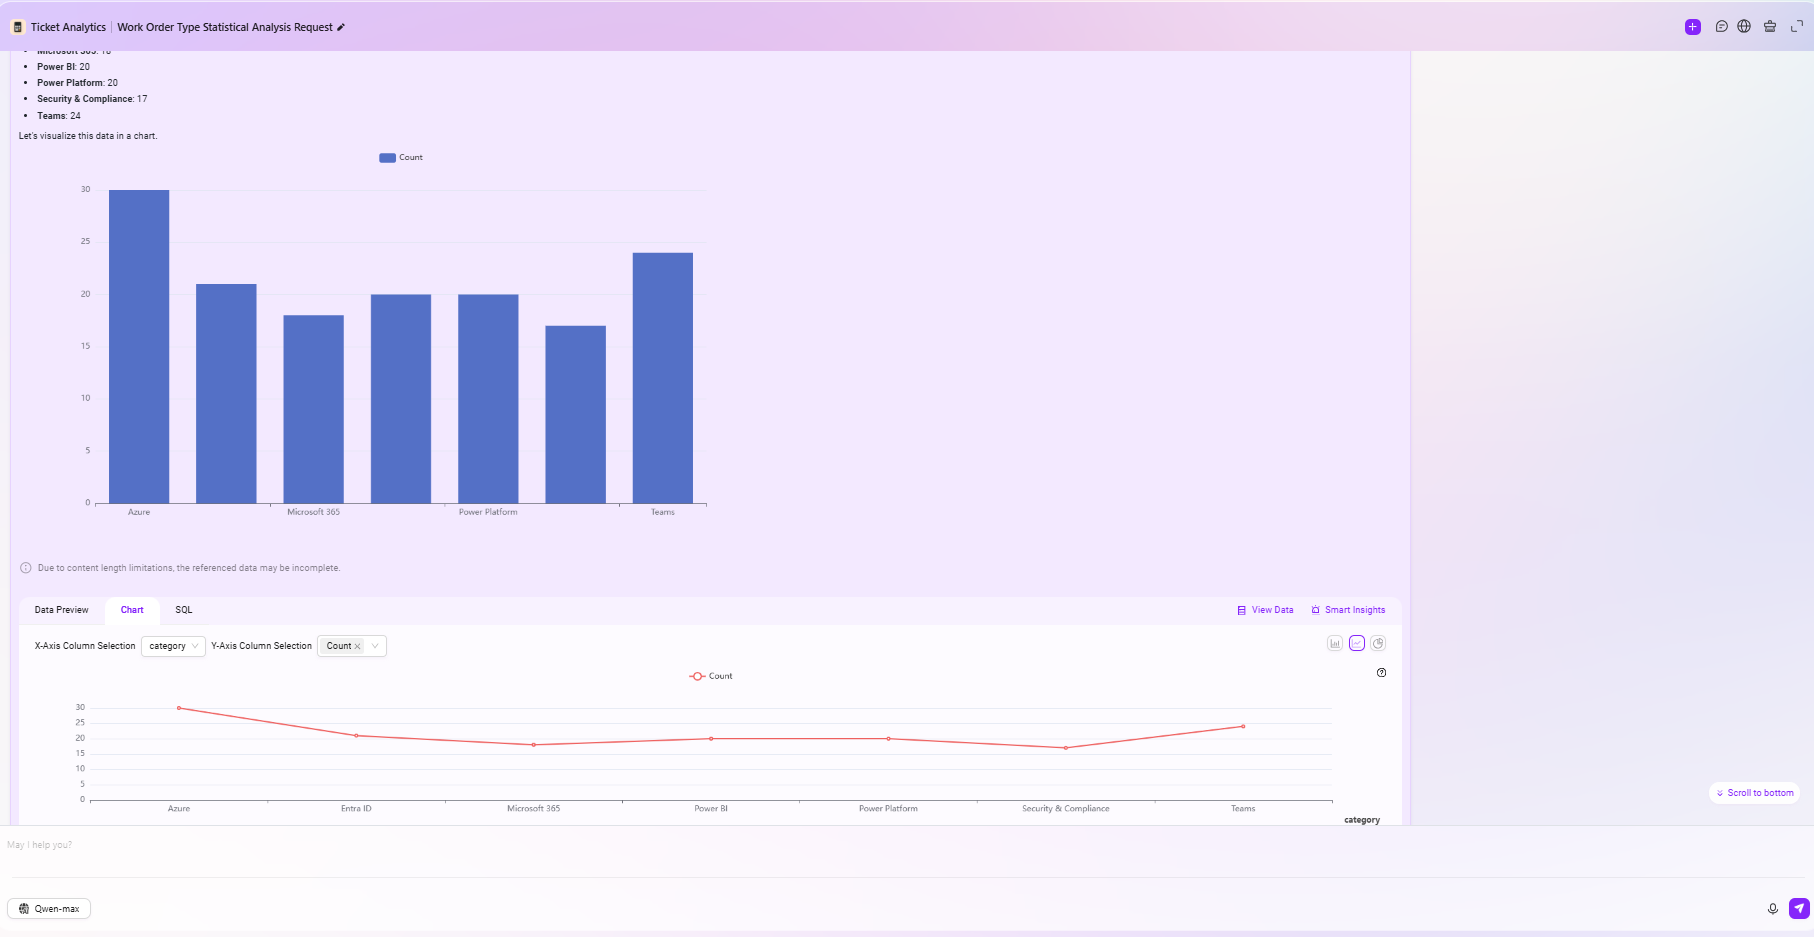
Help me count all ticket data by ticket type and generate statistical charts
As shown in the figure:
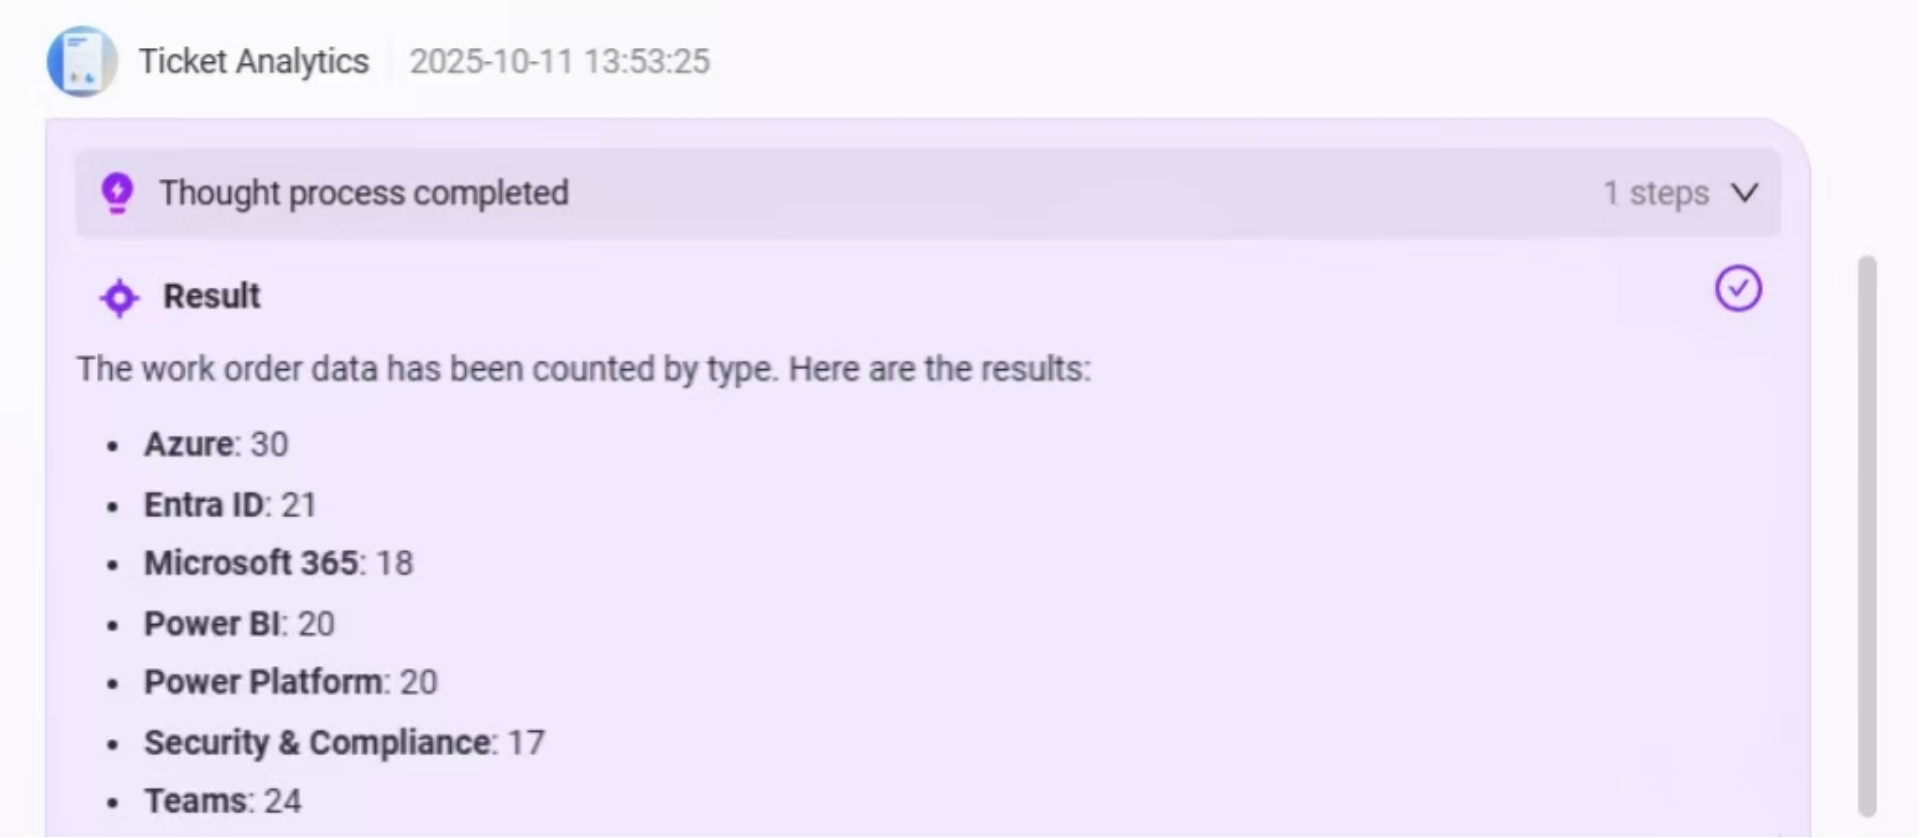
- The Agent will first extract all ticket data from the data source and classify and aggregate according to the
categoryfield, outputting the count statistics for each ticket type;
- Then, the system will automatically generate a bar chart based on the statistical data, visually displaying the comparison of the number of each ticket type, helping users quickly identify high-frequency issue types;
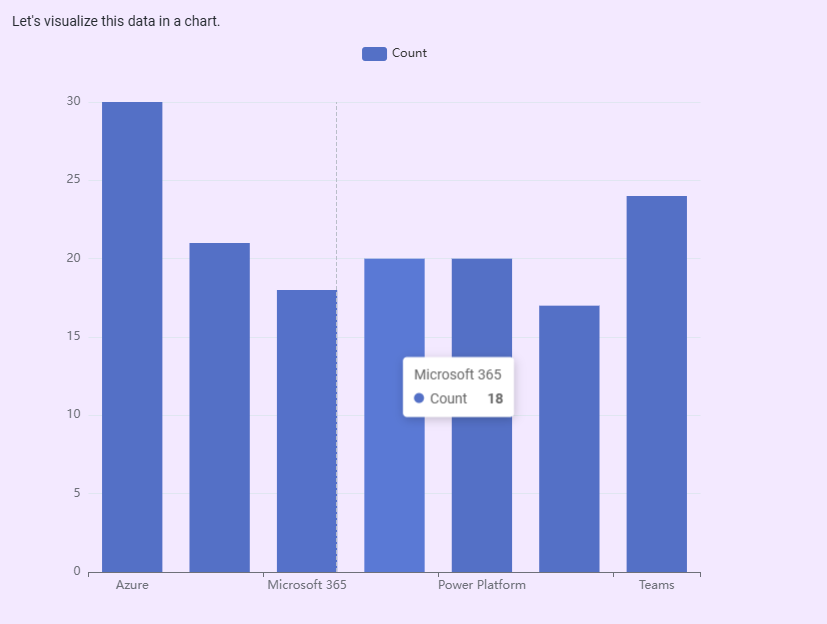
- Below the chart, the system also provides an Intelligent BI Analysis Area, supporting the following functions:
- Data Preview: View the raw data used to generate the chart;
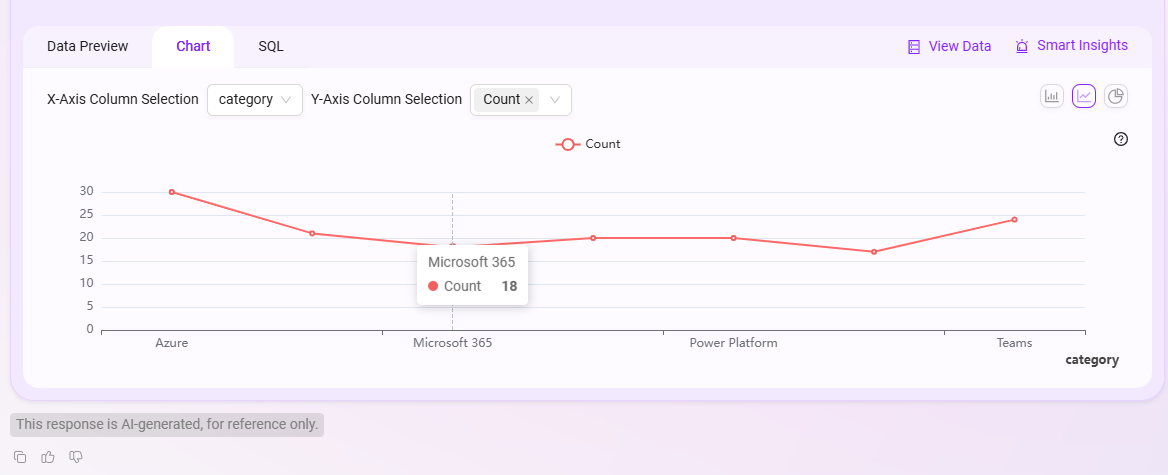
- Chart Editing: Switch the bar chart to line chart, pie chart, etc., and customize X-axis and Y-axis fields;
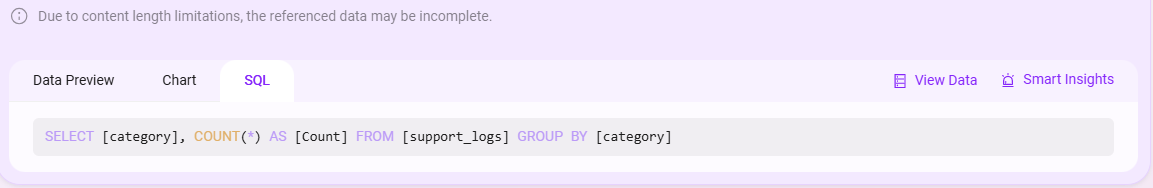
- SQL Query View: View and copy the SQL query behind the current analysis for further analysis or reuse;
- View Data: Click to jump to the raw data table view;
- Intelligent Insights: Click to have the system provide automated insights based on the current data, such as trend analysis, anomaly detection, etc.
Data Preview:
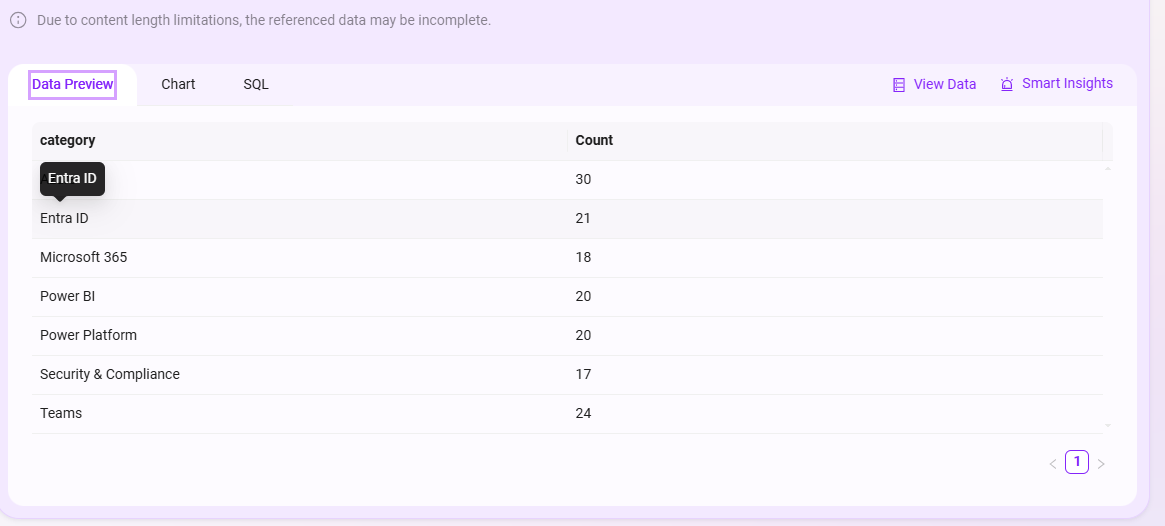
Chart Editing:
SQL View:
The overall Q&A effect is as follows: